Hello folks,
In this blog, we’re going to implement how to automate the datadog monitor for anomaly detection with terraform and terraform provided the Datadog Provider to manage the resources of datadog so I’ve taken the reference from the documentation.
Datadog Provider:
The Datadog provider is used to interact with the resources supported by Datadog. The provider needs to be configured with the proper credentials before it can be used. It requires to terraform 0.12 or later.
Prerequisites:
● Datadog account
● Terraform installation
Let’s set up the datadog free trial account by following the below steps :
1. Fill in the required details for signing up for the account.
2. Choose the AWS stack.

3. Install your first Datadog Agent Choose ubuntu
DD_API_KEY=<PASTE_YOUR_API_KEY>DD_SITE=”datadoghq.com” bash -c “$(curl -L https://s3.amazonaws.com/dd-agent/scripts/install_script_agent7.sh)”
sudo systemctl start datadog-agent

Now let’s verify terraform installation.
Install Terraform:
wget
https://releases.hashicorp.com/terraform/1.3.6/terraform_1.3.6_linux_amd64.zip
unzip terraform_1.3.6_linux_amd64.zip
sudo mv terraform /usr/local/bin/

After that, let’s provision the datadog monitor.
Datadog Monitor :

Monitors can alert you to problems before they impact your users.
To interact with the terraform datadog provider I’m going to create “provider. tf”.
terraform { required_providers { datadog = {
source = “DataDog/datadog”
}
}
}provider “datadog” {
api_key = var.DATADOG_API_KEY app_key = var.DATADOG_APP_KEY
}
Define the variables in “variables. tf”.
variable “DATADOG_API_KEY” {
description = “datadog API key” type = string
}
variable “DATADOG_APP_KEY” {
description = “datadog app key” type = string
}
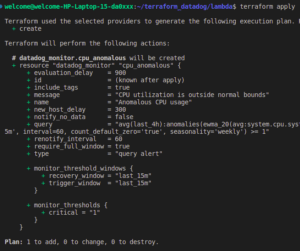
Similarly let’s define the datadog_monitor (Resource) as “datadog_monitor.tf” resource “datadog_monitor” “cpu_anomalous” {
name = “Anomalous CPU usage” type = “query alert”
message = “CPU utilization is outside normal bounds” query =
“avg(last_4h):anomalies(ewma_20(avg:system.cpu.system{env:prod,service:websit e}.as_rate()), ‘basic’, 2, direction=’below’, alert_window=’last_15m’, interval=60,
count_default_zero=’true’, seasonality=’weekly’) >= 1”
monitor_thresholds { critical = 1.0
}
monitor_threshold_windows { trigger_window = “last_15m”
recovery_window = “last_15m”
}
renotify_interval = 60
evaluation_delay = 900
}
Now let’s apply the changes.
First, we need to initialize the terraform working directory.
$ terraform init
We need to export the environment variables before planning and applying the terraform actions.
export TF_VAR_DATADOG_API_KEY=<> export TF_VAR_DATADOG_APP_KEY=<>
$ terraform plan
$ terraform apply

Conclusion:
Therefore, In this blog, we have seen how easily we have provisioned the datadog_monitor resource using the terraform. If you like this blog, please show your appreciation by giving thumbs-ups and sharing it with your friends.
